
Every month brings a new group of first-time customers, and how many of them come back for a second order shows whether your store is getting better at keeping the people it wins.
Repeat purchase rate puts a number on how many customers come back: the share who place more than one order in a set period. But the quick version most stores check mixes customers who first ordered years ago with ones who arrived last week, so it can look healthy while new customers stop coming back.
Measured on a cohort, the same rate answers a sharper question: of the people who placed a first order in March, how many ordered again within 90 days? The cohort rate moves within a quarter of a change to your post-purchase emails, offers or products, so you can see which changes bring more customers back.
This guide shows how to calculate the rate and set up a 90-day or 180-day cohort, what counts as good in your category, where to find the numbers in Shopify and how to raise them.
How do you calculate repeat purchase rate?
To calculate repeat purchase rate, divide the number of customers who placed two or more orders during a period by the total number of customers who ordered in that period, then multiply by 100:
Repeat purchase rate = Customers with two or more orders ÷ Total customers × 100
Say 5,000 customers ordered from your store over the past 12 months, and 1,100 of them placed at least two orders in that time. Your 12-month repeat purchase rate is:
1,100 ÷ 5,000 × 100 = 22%
Most published benchmarks use this 12-month version. BS&Co, an email and SMS agency, counts a repeat customer as one with two or more orders within a 365-day window in its February 2026 benchmarks.
Repeat customer rate usually means the same thing, but purchase frequency and time to second purchase measure different things.
What counts as a repeat purchase?
A repeat purchase is any order a customer places after their first, but a few choices change the result, so settle them before you compare one period with another:
- Count customers, not orders. If the 1,100 repeat customers above placed 3,000 of the store's 6,900 orders, about 43% of orders came from repeat customers. The 43% is a share of orders, not a repeat purchase rate, though it's often quoted as one.
- Match each customer across orders. The rate depends on recognizing the same person every time. A customer who checks out with two email addresses looks like two one-time buyers.
- Leave out test and canceled orders, so they aren't counted as second purchases.
- Decide how to treat subscriptions. Every renewal is a new order, so a store with many subscribers gets a high repeat rate almost automatically. Report subscribers separately.
- Keep the period the same. A 12-month rate is usually higher than a 90-day one for the same store, so compare like with like.
Make these choices once and apply them every time, so a change in the rate reflects your customers rather than how you counted them.
Why a 90-day or 180-day cohort beats an all-time rate
A second-purchase cohort follows one group of new customers and counts how many order again within a fixed number of days of their first order. Because everyone gets the same number of days, a cohort is far more useful for running a store than an all-time ratio.
The all-time version, every customer who has ever ordered twice divided by every customer you've ever had, is easy to misread:
- The figure drifts with the store's age. Customers who joined years ago have had years to come back, and once they have, they count forever. An older store's figure can hold steady while fewer new customers return.
- Acquisition swings the rate. A big Black Friday or a new paid channel adds thousands of first-time buyers who haven't had time to order again, so the rate falls for reasons that have nothing to do with loyalty.
- A change gets lost in the history. If you rebuilt your post-purchase emails in March, the March cohort's result is the evidence, and an all-time figure buries it under years of older orders.
A cohort avoids each of these problems. Group customers by the month of their first order, give each of them the same number of days from their own first order and count who orders again:
90-day second-purchase rate = New customers who order again within 90 days ÷ New customers in the cohort × 100
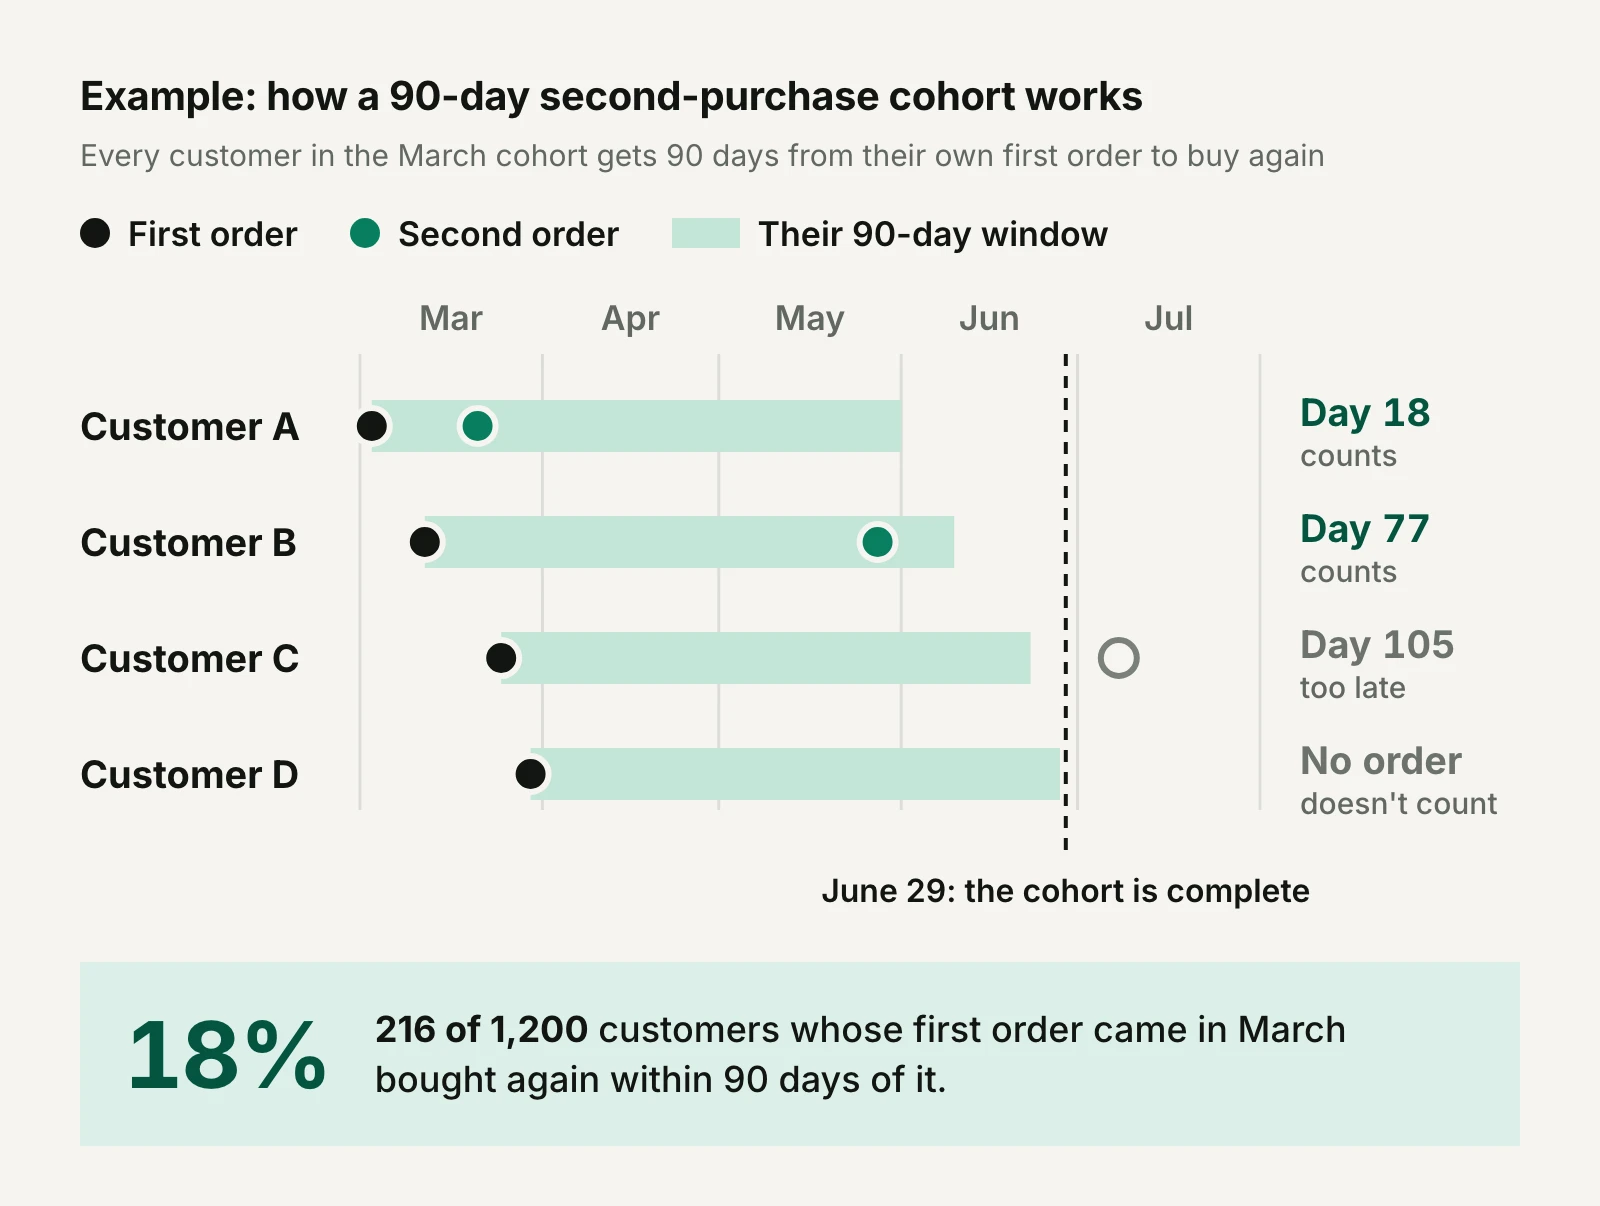
As an example, say 1,200 customers placed their first order in March and 216 of them ordered again within 90 days. The March cohort's 90-day second-purchase rate is then 18%.
You can read the rate once the last March customer has had 90 days, on June 29, and compare it with February's and April's results at the same age.
Ninety days captures most of the second orders a full year would show. In BS&Co's data on 40,397 DTC repeat buyers, half placed their second order within 30 days of the first, 76.4% within 90 days and 87.1% within six months:
50.3%
Repeat buyers who placed their second order within 30 days of the first
76.4%
Repeat buyers who placed their second order within 90 days
87.1%
Repeat buyers who placed their second order within six months
BS&Co's data covers only customers who did come back, so it shows when second orders arrive rather than how likely they are. Even so, the timing makes the case for a short window: a 90-day cohort gives you about three-quarters of the signal in a quarter of the time.
Which window should you use?
The right window for a second-purchase cohort depends on how quickly your customers usually return. BS&Co's medians by type of brand are a useful starting point:
| What you sell | Median time to a second order in BS&Co's data | Window to manage with | Window to confirm with |
|---|---|---|---|
| Fashion and apparel | 15 to 27 days | 30 and 90 days | 365 days |
| Supplements, food and other consumables | 27 to 68 days | 90 days | 365 days |
| Home decor and general retail | 30+ days, with the most erratic timing | 180 days | 365 days |
A 90-day window is ideal for consumables and most fashion brands, because the bulk of their second orders arrive inside it. A 180-day window is better suited to home goods, jewelry and gifts, where purchases are rarer and less regular.
Your own data is better still. Take the customers who placed a second order last year and find the median number of days between their first and second orders.
Repeat purchase rate vs. customer retention rate vs. returning-customer revenue share
Repeat purchase rate, customer retention rate and returning-customer revenue share all describe repeat business, but each one divides a different number by a different base. The three can move in opposite directions in the same month, and Shopify's returning customer rate adds a fourth variation:
| Metric | Calculation | Question it answers | What can move it besides loyalty |
|---|---|---|---|
| Repeat purchase rate | Customers with two or more orders in a period ÷ all customers who ordered in it | How many customers buy more than once? | The length of the period, and a late surge of new customers who haven't had time to return |
| Customer retention rate | Last period's customers who buy again this period ÷ last period's customers | How much of an existing customer base keeps buying? | Who you acquired in the previous period, and it takes a full period to show any change |
| Returning customer rate (Shopify) | Customers in a period who had ordered before ÷ all customers who ordered in it | How much of this period's audience is returning? | Acquisition campaigns lower it, and a larger base of past customers raises it |
| Returning-customer revenue share | Revenue from returning customers ÷ total revenue | How much of the business runs on existing customers? | Order sizes and discounts for new and returning customers, and acquisition spend |
Revenue share and repeat rate don't move one for one. In BS&Co's client data, consumable brands with repeat rates of 39% to 41% earned 62% to 64% of their revenue from returning customers, about 1.5 times their share of customers.
Fashion and apparel brands at 15% to 17% earned 13% to 19% of revenue from returning customers, roughly in line with their share. Repeat buyers of consumables keep reordering, so they're worth more than their headcount suggests.
Keep the comparisons like for like. Bluecore's 27.4% average for 2024 is an annual customer retention rate across more than 100 retailers, so don't measure a 90-day repeat rate against it or against annual retention benchmarks by category.
What's a good repeat purchase rate?
A good repeat purchase rate depends mainly on what you sell. Consumable brands typically reach a 30% to 40% repeat purchase rate over a year, compared with 12% to 17% for fashion brands and 10% to 15% for durable goods, according to BS&Co.
BS&Co's February 2026 analysis covers 156,110 customers of the agency's DTC client brands, with an overall rate of 18.8% and individual brands ranging from 7.1% to 44.2%. BS&Co also gives a gut check for each type of brand:
| What you sell | Typical 12-month repeat rate | Range in BS&Co's data | Gut check |
|---|---|---|---|
| Consumables, such as supplements and food and beverage | 30% to 40% | 22% to 44% | Below 25% is a retention problem worth investigating |
| Fashion, including apparel, beauty and jewelry | 12% to 17% | 10% to 17% | Below 10% suggests something is broken in the post-purchase experience |
| Durables, such as home decor | 10% to 15% | 7% to 18% | Above 15% is outperforming the norm |
The window changes a benchmark as much as the category does. COREPPC, a paid-media agency, found a median repeat rate of 11% at 30 days, 16% at 90 days and 27% at 365 days across 471 Shopify stores in its 2026 benchmarks:
Median repeat purchase rate by window, Shopify stores
471 stores in COREPPC's 2026 audit sample
COREPPC's 30-day medians by category ran from 3% for electronics to 18% for food and beverage. A 30-day rate of 7% would be typical for an apparel store but weak for a supplements brand, so a benchmark without a window attached tells you very little.
The most useful benchmark is your own earlier cohorts. If March's 90-day rate beats February's and January's, your store is improving, whatever the averages say.
How to find repeat purchase rate in Shopify
Shopify doesn't report a repeat purchase rate under that name. The returning customer rate, customer reports and Customer cohort analysis report get you close, and the customer segment editor can count a second-purchase cohort.
What is Shopify's returning customer rate?
Shopify's returning customer rate is the percentage of customers who placed orders in a date range who had already ordered before. Shopify's analytics fields reference gives the formula as returning customers divided by customers, and notes that most stores display 20% to 40%.
The returning customer rate describes who bought in a period, so it's closer to a returning-customer share than to a cohort repeat rate.
For an all-time ratio, the Returning customers report lists every customer whose order history includes two or more orders, and the One-time customers report lists those with only one.
Find both under Analytics > Reports, filtered by the Customers category. Shopify notes that its customer reports use each customer's entire order history, not only the orders placed in the selected timeframe.
How does Shopify's customer cohort analysis work?
Shopify's Customer cohort analysis report groups customers by the date of their first order and shows their activity in the weeks, months or quarters that follow. The report's customer retention rate metric is the percentage of a cohort that placed an order in a given period, so each cell describes one period on its own.
Don't add cells together to get a 90-day rate, because you'd count a customer who ordered in two different months twice.
The report's cohort definition filters make it useful for improving your repeat rate. You can limit a cohort by its first order's sales channel, marketing channel, marketing type, product name or subscription status.
With those filters, you can compare customers whose first order was your best seller with those who started on a gift set, or customers acquired through email with those from a paid channel.
How do you count a 90-day second purchase in Shopify?
Shopify's customer segment editor can count a second-purchase cohort with its first_order_date and orders_placed filters, both documented in its segment reference guide. When you run a query, the number of matching customers appears above the editor. For customers whose first order came in March 2026:
- Enter
first_order_date BETWEEN 2026-03-01 AND 2026-03-31and note the number of matching customers, which is the size of your cohort. - Enter
first_order_date BETWEEN 2026-03-01 AND 2026-03-31 AND orders_placed MATCHES (count >= 2, date BETWEEN 2026-03-01 AND 2026-06-29)and note the number again. The new count covers the cohort's customers with at least two orders by June 29, 90 days after the last day of March. - Divide the second number by the first and multiply by 100.
Because the window ends on a fixed date, a customer who first ordered on March 1 gets 120 days and one who ordered on March 31 gets 90. The uneven windows are fine for comparing months, as long as you apply the same rule to each one, and weekly cohorts narrow the spread.
For an exact window for every customer, export your orders and calculate the rate from each customer's first-order date.
How to increase your repeat purchase rate
You can increase your repeat purchase rate by making the first order worth repeating, staying in touch through the weeks when most second orders arrive and making the next order easy to place. Measure each change against the cohorts it should affect, at the same age, before and after.
The second order is also the first step in keeping customers for the long run, which takes easy reordering, coordinated messages and win-back as well.
How the first order shapes the second
A second order starts with a first one that lives up to its promise: the product works, it arrives when expected and, for apparel, it fits. Where customers who start on a particular product rarely come back, look at that product's reviews, returns and support tickets before rewriting any emails.
The first product can make a large difference. In one UK personal-care store that the analytics company DataDrew analyzed for its September 2026 benchmarks, the 12-month repeat rate ranged from 12.1% to 37.8% depending on which product a customer bought first.
Shopify's cohort report can filter by first-order product, so you can run the same comparison on your own store.
Post-purchase messages that run for 90 days
Post-purchase flows that stop after a week or two miss most second orders. BS&Co says most flows end after 7 to 14 days, and it recommends running them for the full 90 days instead.
BS&Co's suggested sequence starts with product tips in the first week, then reviews and social proof. A replenishment reminder follows around days 20 to 30, then a small incentive around days 45 to 60 and a final reminder between days 75 and 90.
BS&Co also advises against suppressing recent buyers from campaigns for 30 to 60 days after they order, because that silences you during the weeks when half of second orders happen.
A longer flow should lift your 30-day and 90-day rates first, and email, SMS and push notifications can share the work.
Reorder messages for the same product
Most second orders are the same product again: 77% across 7,454 second-purchase journeys in BS&Co's data, and 82% to 93% at its supplement brands. A "ready for another?" message with a one-click reorder link suits those customers better than a grid of new products.
Campaigns that feature your best sellers follow the same logic. Time reorder reminders to how long the product lasts, so they arrive just before customers run out rather than on a fixed day for everyone.
Home decor is the exception: none of BS&Co's home decor second purchases were the same product, so lead with the rest of the catalog there.
How acquisition offers affect your repeat rate
The customers your marketing attracts shape your repeat purchase rate before any follow-up begins. George Sylvain, co-founder of Social Print Studio, studied 106 high-growth Shopify stores with the analytics company Tresl.
Sylvain found that 13.95% of the new customers acquired over BFCM 2024 ordered again within six months, against 19.2% of new customers acquired at other times of the year. The BFCM buyers spent more on their first order, $159 against $120, and Sylvain puts the gap in repeat orders down to deal-driven buyers.
Sylvain's comparison is a 180-day cohort, so you can run the same one on your store. Split cohorts by first-order marketing channel, discount and season, then move budget toward the sources whose customers return.
If Black Friday brings in a big share of your new customers, plan its offers around the second order before the sale starts.
How subscriptions and multi-packs change the rate
Subscriptions and multi-packs secure the next order at the first one. BS&Co recommends both for consumables, where most second orders are reorders anyway. Subscriptions are best suited to products customers use at a steady rate, such as coffee, supplements and pet food.
But the two change the metric in opposite directions. Every subscription renewal is a new order, so subscribers push the repeat rate up automatically. A customer who buys a three-pack may not need a second order for months, which pulls a 90-day rate down even though you've sold more.
Track subscribers as their own cohort, which Shopify's cohort report can filter by, and judge multi-pack offers on revenue per customer rather than on repeat rate alone.
Loyalty rewards for customers who come back
A loyalty program is a strong fit when customers already buy several times a year, because they can reach a reward within a realistic number of orders.
Rewards don't have to be discounts. French skincare brand Yon-Ka Paris reached a 50% repeat purchase rate without relying on discounts, Raphael Faccarello, its global ecommerce director, told our podcast. Yon-Ka built that rate on loyalty tiers, app-based rewards and full-size gifts at Black Friday.
Final thoughts
Repeat purchase rate is only as useful as the window behind it. An all-time figure tells you roughly how loyal your customer base has been. A 90-day or 180-day cohort tells you whether the customers you won last month are coming back, and whether your latest change is working.
Start with your last few monthly cohorts and find the window that fits how fast your customers reorder. Then compare each new cohort with the ones before it, and you'll have a number you can act on within a quarter.
Frequently asked questions
Is repeat purchase rate the same as repeat customer rate?
Repeat purchase rate and repeat customer rate usually mean the same thing: the share of customers who placed more than one order in a period.
Some tools use "repeat rate" for the share of orders placed by returning customers instead, which gives a higher number for the same store. Check whether a figure divides by customers or by orders before you compare it with yours.
What's the difference between repeat purchase rate and purchase frequency?
Repeat purchase rate counts how many customers buy more than once, while purchase frequency counts how many orders the average customer places in a period.
A store can raise purchase frequency by getting its regulars to buy more often without bringing back any more first-time buyers. Track both: repeat rate for getting customers to a second order and frequency for how deep relationships go after that.
Do win-back campaigns improve repeat purchase rate?
Win-back campaigns can raise a 12-month or all-time repeat purchase rate, but they rarely move a 90-day second-purchase rate, because they target customers who have already gone quiet.
BS&Co notes that win-back flows typically start at 90 to 180 days, after most second orders have already happened. Win-back is better judged by how many lapsed customers it brings back than by a 90-day rate.
How long does it take to see a change in repeat purchase rate?
A change to your post-purchase journey appears in a 30-day second-purchase rate about two months after you make it, and in a 90-day rate after about four.
If you change your flows at the start of March, the March cohort's 30-day rate is complete on April 30 and its 90-day rate on June 29. A 12-month rate takes more than a year to reflect the change fully.
Does a higher repeat purchase rate always mean more profit?
A higher repeat purchase rate doesn't always mean more profit, because the rate counts customers who return, not what their orders earn.
Repeat orders bought with deep discounts can raise the rate while lowering margin, and a multi-pack can lower the rate while raising revenue. Pair the rate with customer lifetime value and contribution margin before deciding how much to spend on bringing customers back.